Thursday 21 December 2017

UK Peak Demand is still on a Downward Trend

From Regen SW Graphic of the month

The good news? - Peak UK demand is falling - thanks mainly to more efficient appliances, as well as the observance of triads by - in the main - large industrial users.

The bad news? - At home we largely ignore the stress on the system at peak times, and merrily carry on dishwashing and doing laundry at peak times - stop it!

Tuesday 19 December 2017

What is important, cost or reliability of supply?

From World Economic Forum
Like the island of Mauritius, UK has an electricity supply system with reliability of well over 99.9%. This is unheard of in most of the less developed world.
Despite our lax and irresponsible use of electricity, we continue to throw money at the problem of peak demand.
In countries where this is not an option, the lights go out on a regular basis, and people suffer. Vaccines and other medicines are damaged through lack of refrigeration, children can't study, vital communication systems are disrupted.
Will we wait until we are in the same boat before we do enough  in UK to flatten our demand?
Its up to all of us to raise awareness.

Friday 1 December 2017

Firm Frequency Response - what is it and why do we need it?


Our electricity system operates at a frequency of 50Hz, within limits as above.
Currently (no pun intended!) the National Grid is calling for suppliers to quote for fast response generation and/or storage to keep the frequency within its narrow boundaries.

There are two ways of looking at this: either

  •  it is a commendable and efficient way to address peak capacity issues, only paying for generation that is actually needed
or
  • it is an admission of failure to communicate to the consuming public the value of relatively modest changes in behaviour that would substantially reduce peak demand and render such projects unnecessary
Which view you take will depend on your faith in humanity's ability to respond effectively to calls for responsible action, or your belief in a centralised top-down system that makes no serious effort to raise public awareness of the value of behaviour change.

We are in danger of being reduced to cargo-cult status, where collectively we receive benefits from above that we can neither influence nor understand.


Friday 29 September 2017

Share of Renewables in Total Generation Looking Good - How can it be Increased Further?

We reached 30% of electricity from renewables in quarter 2 of 2017 - thank you Regen SW for your Graphic of the Month. But this is only for one quarter - the average for 2016 was 24%.

Will we get to 30% for a whole year by 2020, which is the national target?

The seasonal variations in wind and solar PV suggest that what is most needed is more wind power to boost Q4 and Q1 generation, when solar is at its lowest, and wind is statistically higher.Reading from the graph, this would require wind going from around 12% to 18% of generation in those quarters, a 50% increase in wind generation.

You can forget storage as a means of ironing out seasonal variation - a battery large enough to store electricity in sufficient quantity to shift supply for several months would be very big, even more expensive than more nuclear power.

Any ideas on how to shift consumption from winter to summer? More energy efficient homes would help!

Monday 4 September 2017

Falling Carbon Intensity - Can we Keep it Falling?


As this excellent graphic from Regen SW shows, we have successfully halved the carbon intensity of our electricity supply over the last 25 years.
Much of this was due to the substitution of gas for coal in the 1990's. A further, but lesser drop is due to the more recent substitution of renewables for coal, over the last five years.
But how do we keep this  rate of progress up?
It's not good enough just to say with more renewables - they are intermittent and do not occur in reliable quantity when we most need them, on cold dark winter evenings.
The answer is to shift when we use electricity, away from peak times and into times of low demand and when the sun is shining or the wind is blowing.
As a first step, you innovators and early adopters already know what to do... and to tell your friends!

Thursday 10 August 2017

How Fast are our Consumption and Generation Patterns Changing?


Oh dear, another set of graphs!

The good news is I only want to look at the right hand side one - you can see how since 2013, coal has plummeted, and gas has more modestly increased. Nuclear has stayed more or less constant, solar and wind have increased but are still a very small part of the total.
Here's another perspective - the modest decline in overall demand is accentuated in total fossil consumption - i.e. coal and gas together have declined faster than consumption, because renewables, nuclear and interconnectors have all increased.

For the green renewable line to go up further and faster we will need much more demand side response - so get time-shifting and tell your friends!

Monday 7 August 2017

Solar Share of Generation in Europe is Plateauing


The share of electricity generation in countries known for their keen pursuit of it in the past, notably Germany, has plateaued.

In Germany's case, at 6% of generation. Sunny Greece and Italy are marginally better at around 8%.
Germany has a moratorium on nuclear power, but this has not caused an increase in solar electricity generation.

There are technical as well as political reasons for this.

It gets progressively harder to increase solar's share of generation, particularly in countries where the supply and demand are substantially out of sync with each other, as is the case in Northern Europe.

The answer? More time-shifting of domestic demand of course!


Thursday 3 August 2017

Hi , I'm Tom Langdon-Davies from a farm near Exeter in sunny Devon, South West England. I have worked all over the world for energy companies, renewable and conventional. Now it's time for me to see what I can do to raise awareness of the easy things we can do to make our energy more sustainable. Thanks for reading. Please help me by commenting!


After a brief spell seismic surveying around Europe and Africa, I ran the Natural Energy Centre in London - that was back in 1977, and we did it all. Wind, solar, heat pumps, biomass. After that I did a stint at the Electricity Council in Millbank , encouraging night-time battery charging, back when the UK electricity supply industry was still nationalised.
We moved to Devon in 1984, installed solar PV, wood-burning stoves, and I got a grant to put in a biomass supply system at Occombe Farm in Torbay.
Devon and Cornwall are now blessed with more wind and solar electricity than they can use - unless we start to seriously shift when we use it, from times of peak demand to times of trough demand, and also into times when the sun is shining and the wind is blowing.
Please take a look at the blogs I have written over the last two years - and comment on them or publicise them. Let me know if I can do the same for you!
Thanks

Wednesday 2 August 2017

Regen SW Remind us of Falling Peak UK Electricity Demand


As I pointed out several months ago, and Regen SW remind us, peak winter electricity demand in UK is falling.


However, the shape of the demand curve remains much the same - in 2016/17 the winter peak at around 5:30 PM was still 7GW higher than the daytime plateau - domestic DSR is still under 10% of the way up the adoption curve.
This is what can make a big difference if we continue to engage with each other. Let's raise the awareness of the issue beyond the 3 million or so consumers who seem to be doing something about it.

The crunch will come as electric vehicles start to push demand back up again - then we will need to flatten the curve to avoid another 2 or 3 large nuclear power stations at a cost of over £50 billion.

Tuesday 25 July 2017

Gandhi - "everything you do is absolutely insignificant, but it is very important you do it."


It's time for a little bit of philosophy!
We often think "wouldn't it be nice if...." and then say something that we would like to happen, that would happen if many people took action, but we feel powerless to cause or bring about.
Domestic Demand Side response was one of these for me.
Until a couple of years ago, I did not believe it was possible to get people to shift the times at which they use appliances to reduce UK peak electricity demand.

But it is now starting to happen. The people with PV systems or Economy Seven tariffs are not only doing it, they are increasingly realising the collective benefits of doing so, and the conversation has changed. The word is spreading.

Gandhi went further than this in what he said.

Not only are you only one of thirty million electricity consuming households, but everything you do is ultimately and inherently insignificant - paradoxically this empowers us to take action just because it's the right thing to do,without any expectation of outcome. In my experience, the results can be unpredictable, exciting, and transformative.

Go on, give it a try!

Wednesday 19 July 2017

How Far up the Adoption Curve for Domestic DSR are we?

There are around 30 million electricity consumers in UK and as many of them as possible need to be shifting their time-of-use away from peaks if we are to avoid an extremely costly upgrade of the distribution system , as well as a ramped-up rollout of nuclear at £8,000/kW and rising.
That's the challenge. But how many are already doing so?

There are in UK around

  • 800,000 solar PV installation owners or tenants, most of whom take advantage of "free" electricity when the sun shines
  • 1.7 million storage heating installations, on economy 7 tariffs, using night-time electricity.
  • 0.1 million heat pumps, many of which are on smart connections
  • A few hundred thousand people like you and I who know that DSR is a good idea

So around 10% of domestic users, 3 million, have some awareness of the value of time-shifting, and most are at least taking some action where it is to their financial benefit.


So we are  at the end of the early adoption phase for awareness - the 10% of innovators and early adopters needed to get a technology off the ground.

Of course awareness and appropriate action are not the same thing, but awareness is a necessary precursor to action. 

Let's keep pumping the message out!

I am, are you?

Tuesday 11 July 2017

Is Solar in UK Like Solar in California?


On 3rd May, California had a capacity crisis. Their hydro power reserve had run out of water because of the drought, there was little wind, and the peak demand even in air-conditioned California was after dark. Demand side response came to the rescue thanks largely to Enernoc, and 800 MW was lopped off the  34 GW or so of peak demand, preventing large-scale outages. (The green net demand curve is net of solar PV and of DSR)
But look at how much of the near-peak demand is met by solar.
In UK , in winter, this would not happen. Our peak demand occurs several hours after the watery winter sun has already set. 
All the more reason, then, to be concerned about getting as much time-shifting as possible out of the winter peak. The alternatives to this are:
  • Power outages
  • More expensive nuclear electricity
  • More carbon emitting gas-fired electricity
  • Expensive and polluting storage
  • The energy trilemma writ large - unaffordable, unsustainable, unreliable electricity

So - be an early adopter, get ahead of the game, and prepare for next winter by planning to shift all water heating appliances out of the 3-8pm peak! Hundreds of thousands already time-shift, do you?


Tuesday 4 July 2017

Where is Storage Needed?


Is electricity storage a good idea? Where is it needed?

  • In the countryside, where the solar and wind power are generated?
  • Or in towns and cities, where most of the electricity is consumed?
Peak demand is an issue in the cities, but handling PV on a sunny day is a rural issue - so we probably will need both - but the more we shift our demand, the less expensive storage we will need - happy time-shifting!


Friday 23 June 2017

If we don't have more Nuclear, how will Peak Winter Demand be met?


The National Audit Office is questioning the value for money to consumers of Hinkley C.
What is the alternative?

  • Not more solar or wind, which are intermittent or nonexistent at peak times
  • Not more gas, which is a carbon emitter.
  • Not more hydro, there aren't enough rivers or mountains in UK
Which leaves
  • Undersea links to the continent, i.e. let someone else worry about it
  • Storage, which is expensive and some say carbon emitting 
  •  Time-shifting, as I've always said

Simple but not easy unless we all do our bit. Tens of thousands are already doing it, are you?

Tuesday 6 June 2017

Make Hay while the Sun Shines


Domestic DSR is about sufficiency.
If we all do our bit for flattening demand, we will need far fewer new power stations, of whatever type.
It also means using renewable electricity when the sun shines or the wind blows.
But we need to know when there is a lot of slack in the system.
Hence the Time Cheese.
How helpful would it be to you to have one?

Tuesday 16 May 2017

Which Appliances are Best to Time-shift?


It is sometimes said that there is not enough energy consumed by wet appliances to eliminate 7GW of peak consumption by time-shifting them alone. I leave you to judge.

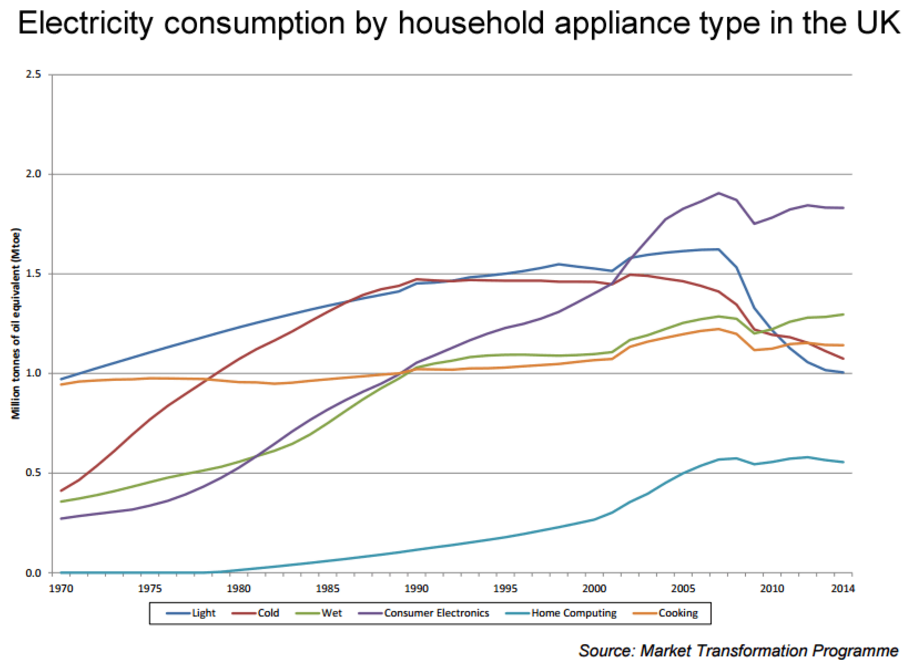
The trend of wet appliances’ consumption has been inexorably upwards, and is now second only to consumer electronics. Much of the increase is due to an undesirable increase in the use of tumble dryers, but I am not here to preach austerity. If you live in a flat or gardenless house, it may be the only realistic option.

Reading off the above graph, we have a Mtoe figure for each appliance type:

APPLIANCE TYPE
Mtoe 2014
GWh (Mtoe x 11,630)
PERCENT OF TOTAL
Light
1.0
11,630
14.2
Cold
1.1
12,793
15.7
Wet
1.3
15,119
18.5
Consumer Electronics
1.8
20,934
25.7
Home Computing
0.6
6,978
8.5
Cooking
1.2
13,956
17.1
TOTAL
7.0
81,410
100

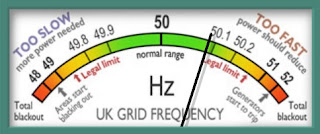
There are around 80 winter days when it is desirable to reduce peak consumption by up to 7GW and by around  18GWh spread over the 5 hours of the peak, so by a total of 80x18=1440 GWh/year. This is 1.7% of total annual domestic consumption, and 9.5% of total annual wet consumption.

There are of course other candidates for time-shifted consumption as well as wet appliances.  Cold devices (mainly fridges and freezers in UK) and increasingly home computing (laptops, smartphones and tablets all have batteries) are if anything even less time-sensitive in direct grid consumption than wet appliances, and are now already 24% of the total vs wet appliances 18.5%. 

The reason we are not focussing on them is the relatively low consumption per device. A typical house may have three wet appliances and ten or more cold and computing ones.

Would you rather go for the wet or the cold and computing!

 It’s up to you. Both is best!


Power to the People now becomes power to, for, by with and from the People.


We are all prosumers now. In the world of food, the Slow Food movements has renamed consumers co-producers - on the basis that when we buy something, we are collectively responsible for the whole supply chain that brings it to us.
 The same can be said of electricity - and we all have the scope to affect the supply chain. The easiest way to begin to do this is to use less - and then to use it when we choose to.
 I choose to use electricity for discretionary purposes at night and when the sun is shining. What do you do?
There are no right or wrong answers, just the power to make informed choices.

Tuesday 18 April 2017

Cutting Peak Consumption Dramatically Reduces Coal-fired Production


Look at these graphs from the right hand side first. The red line on the far right graph shows the admirable decline in coal fired electricity in UK over the last five years.
Over the past year, however, there was a nasty peak in the second half of January, when coal fired stations were brought out of mothballs - see the second graph from the right.
This peak coincides with maximum electricity demand for the year.
As usual the message is clear - reduce demand at peak times to reduce carbon!

Thursday 13 April 2017

Should we adopt Nicaraguan Domestic Electricity Pricing Policies?


If we adopted the Nicaraguan approach, low consumption users would be charged less per unit, and cross-subsidized by domestic consumers who use more.

"Currently, there are cross-subsidies in the tariff structure. Medium voltage consumers pay higher tariffs that serve to subsidize lower tariffs for low voltage consumers. Users that consume less than 150 kWh per month receive transfers from the rest of the consumers. The lowest-consumption users (0-50kWh/month) benefit from reductions between 45% and 63% in their average tariff. Consumers above the 50kWh limit also benefit from the subsidy scheme to a smaller extent." (Wikipedia) 

Easily done with smart meters! No net cost to the Government! Incentive to use less!

Friday 24 February 2017

First Four Days Data from my New Owl Intuition


This is my electricity consumption for four days to 11.00 am on 22nd Feb 2017. There are large peaks for electric shower use, and smaller peaks for off peak heaters at night, and electric kettles.
I am reasonably happy with the relatively low consumption between 3 and 8pm, but I do have an immersion heater that kicks in very shortly thereafter. My wife complains if I leave it any later for it to start! Average consumption is running at 23.5 kWh (units) per day, only just under 1kW average, so let's see if I can reduce that. It should be relatively easy to do so as the seasons warm up (we have no aircon here in chilly England), the big test will be whether I can improve on like-for-like consumption over the years.  I now have almost entirely LED lighting, and mainly new A+++ fridges and freezers. The big consumers are night-time heating, washing appliances and immersion heaters.

Monday 20 February 2017

Interesting (to me anyway!) Appliance Signatures and Consumption

This is a graph from the Owl Intuition device I have just attached to my Owl transmitter. The data is from a clamp on to the feed cable to my electricity meter.
I linked the Owl transmitter to the Intuition receiver plugged into a Devolo broadband repeater. My broadband routers are 20 metres and around 3 metres of cob wall away from the transmitter, so no chance of a direct link!
I can now read the real-time data anywhere with an internet connection.
The graph starts at around 10:12 on 20th Feb and runs for two hours.
The initial base load is around 350 Watts, which is with two routers, TV aerial amplifiers, lights, and assorted fridges and freezers on. I am not proud of this level of base consumption!
The first sharp peak is an electric kettle, on for around one minute. The smoothing in the Owl software makes it look longer.
The subsequent long peak and smaller ones around every ten minutes are the washing machine.
It makes disaggregation (identifying demand from specific appliances) look fairly easy - but in practice it is not as easy as it looks, as several companies are discovering.

Tuesday 14 February 2017

Who Benefits from Rational Electricity Time-of-Use?


If "we" stand to gain £56 billion from 7GW less of nuclear capacity by rational electricity time-of-use, who benefits? Who are "we"?
In the end, we all gain, either as bill-payers or as taxpayers, or as members of their households.
The suppliers will benefit in the short term by paying lower half-hourly wholesale prices at peak times.

Monday 6 February 2017

Wind Exceeds Coal and Equals Nuclear over a day for the Second Time this Year.

UK Electricity Production to 6th Feb 2017.

On the Past Month chart,- third from the left - you can see that on 2nd Feb 2017. wind power - green - exceed coal - black - and virtually equalled nuclear - brown.
Whilst this is a major achievement, it was little more than momentary - wind is not and never will be a predictable source of electricity.
To make better use of it, we need to substantially shift the time we use electricity.
An excellent start is to stop using it for non-time sensitive devices -dishwashers, washing machines, tumble driers, immersion heaters - during the 3-8pm peak in UK
Happy timeshifting! Tell your friends you are doing it - it makes a difference.

Friday 3 February 2017

Heat and Transport need Urgent Decarbonization


Do you think there are problems with the decarbonization of electricity?
Well there are now!
Heat and transport are a long way behind electricity in decarbonizing.
And it will probably be electric solutions that enable them to make progress.
Electric cars, heat pumps and CHP heat all depend on and will increase demand for electricity.
The only way the grid can cope with this is massive domestic demand response.
So get time-shifting now!
Early adopters like you and I are the necessary beginning to this process.

Thursday 19 January 2017

Production peaking at a remarkably stable 50GW


Peak production over the last week has been bumping along as if there were an upper cap of 50 GW. Is this a chance event, or has the National Grid been leaning on big consumers?
The 3-8pm peak remains, though, but at an agreeably lower level of 5GW above daytime consumption. Hooray! Any comments on how much this is by accident and how much by design?

Thursday 12 January 2017

Peak demand lower at 50GW, but 7GW rise remains

UK National Grid Production at 0930 on Thursday 12th January 2017.

Demand peaked at 50.2 GW on 5th January 2017, an encouragingly low level. Total average demand continues to trend down thanks to energy efficiency, LED's etc.
But the peak of 7GW in the early evening remains - we are better at efficiency than we are at demand side response.
But DSR is easier to achieve once we have sufficient awareness of its low cost and high value.
So keep time-shifting and keep telling your friends!

Tuesday 3 January 2017

Green Energy Introduces a Domestic Time-of-Use Tariff

Green Energy Domestic Time-of-Use tariff 1st Jan 2017.
On New Year's Day, Green Energy announced the first 3 price domestic time of use tariff in UK .

Costs are:

Peak       24.99p   16:00-19:00 weekdays

Off Peak  4.99p    23:00-06:00 every night

Normal   11.99p  at all other times

I currently pay 17.6p normal and 5p off peak, on Ecotricity's new Energy Plus tariff. I calculate that ignoring the off peak I would need to use less than 43% of my electricity at peak times to make it worth changing. Unfortunately I am outside the radio range required by smart meters, so I can't switch.

As a fully signed up geek, I am happy to do this calculation, and to measure my hourly consumption using an Owl USB meter.
I wonder how many of us are willing or able to do that?
The simplest thing to do is to use less electricity at peak times, whatever the tariff you are on!