Showing posts with label demand response. Show all posts

Tuesday, 16 May 2017

Which Appliances are Best to Time-shift?


It is sometimes said that there is not enough energy consumed by wet appliances to eliminate 7GW of peak consumption by time-shifting them alone. I leave you to judge.

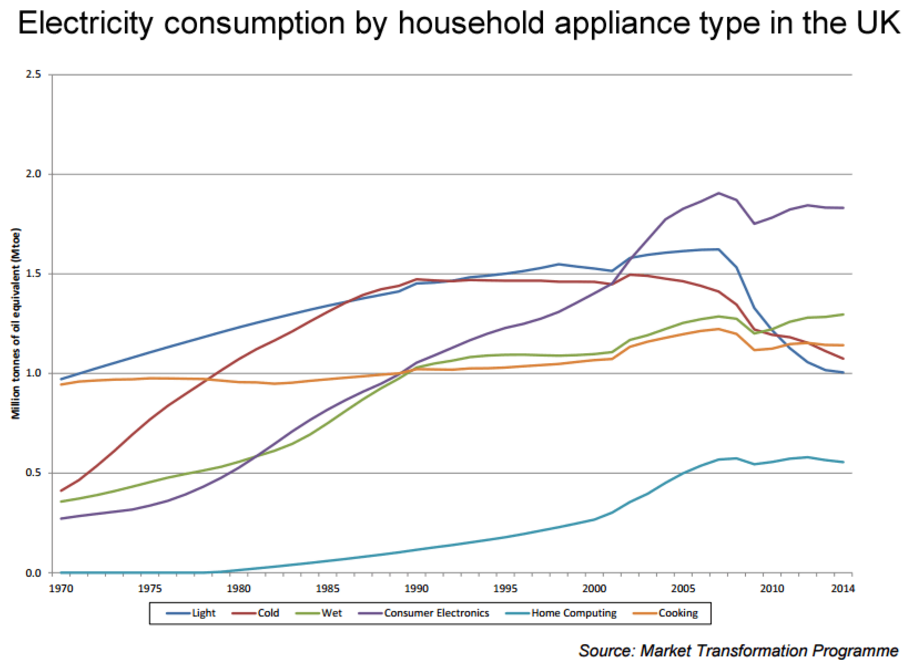
The trend of wet appliances’ consumption has been inexorably upwards, and is now second only to consumer electronics. Much of the increase is due to an undesirable increase in the use of tumble dryers, but I am not here to preach austerity. If you live in a flat or gardenless house, it may be the only realistic option.

Reading off the above graph, we have a Mtoe figure for each appliance type:

APPLIANCE TYPE
Mtoe 2014
GWh (Mtoe x 11,630)
PERCENT OF TOTAL
Light
1.0
11,630
14.2
Cold
1.1
12,793
15.7
Wet
1.3
15,119
18.5
Consumer Electronics
1.8
20,934
25.7
Home Computing
0.6
6,978
8.5
Cooking
1.2
13,956
17.1
TOTAL
7.0
81,410
100

There are around 80 winter days when it is desirable to reduce peak consumption by up to 7GW and by around  18GWh spread over the 5 hours of the peak, so by a total of 80x18=1440 GWh/year. This is 1.7% of total annual domestic consumption, and 9.5% of total annual wet consumption.

There are of course other candidates for time-shifted consumption as well as wet appliances.  Cold devices (mainly fridges and freezers in UK) and increasingly home computing (laptops, smartphones and tablets all have batteries) are if anything even less time-sensitive in direct grid consumption than wet appliances, and are now already 24% of the total vs wet appliances 18.5%. 

The reason we are not focussing on them is the relatively low consumption per device. A typical house may have three wet appliances and ten or more cold and computing ones.

Would you rather go for the wet or the cold and computing!

 It’s up to you. Both is best!


Monday, 25 July 2016

Is a Northern Global Grid Link feasible?


The Arctic Circle is just over 10,000 miles long. A supergrid running its full length would allow solar PV and other forms of low carbon electricity to be transmitted from daylight areas to evening areas.

It would be shorter than the 12,000 miles of the UK high voltage grid.

National grids in Canada, Scandinavia and Russia could be connected, with substantial potential for generation capacity reduction. 

The growing geothermal output of Iceland could then also be fed into it. An Iceland/UK link is already being planned.

With global warming, northerly latitudes will become increasingly attractive places to live, so this is a useful piece of infrastructure for the world's future.

Or do you think such grand projects are extravagant and environmentally dubious?

 If so, your best bet is to follow my advice and timeshift your electricity consumption out of the peak and into the trough!

Happy timeshifting!

Friday, 10 July 2015

Demand Response and storage - how much of each do we need? Wattstor may have part of the answer.


A new company in Cornwall - Wattstor - has a useful piece of kit which enables PV system owners to dramatically reduce the amount of electricity they need from the grid in summer. It stores surplus electricity during the day - up to 6kWh - which is then available in the evening.
I spent over £12,000 on a 4kW PV system , so I am a prime candidate for Wattstor.
Will it make any difference  to peak winter electricity demand - when there is very little daytime PV generation?
The Wattstor system costs several thousand pounds - mainly for batteries. If it shifts sufficient summer electricity from day to evening, it will pay for itself.
Delay timers and time switches will have the effect in winter of reducing peak demand at low cost with high reliability.
Perhaps someone could do the sums to calculate the ROI and carbon reduction of each approach?

Tuesday, 3 February 2015

Is the double peak evidence of effective UK demand management?

Today for the first time I noticed that electricity demand peaked twice - at 1730 and again at 1845 ( 2nd Feb 2015).
Both peaks were 52.4 GW, with a "trough" of 51.7 GW at 1830.
Furthermore, demand was almost flat for a full twenty minutes from 1730 to 1750
Why am I telling you this geeky fact?
It looks as though the reason for this is demand response kicking in.
Industrial users anticipate high "Triad" charges which can occur without warning on days of very high peak demand in February .


Here is a screenshot from Stephen Morley's excellent realtime National Grid  site for 2nd and 3rd Feb

The double peak is clearly visible.

It shows that demand response works!

I wonder what the peak would have been without it?

Let's all do what we can with our own domestic consumption to pull the peak right down to the 1500 and 2000 figure of around 47GW by this time next year!

Happy demand side responding!