Friday, 23 June 2017

If we don't have more Nuclear, how will Peak Winter Demand be met?


The National Audit Office is questioning the value for money to consumers of Hinkley C.
What is the alternative?

  • Not more solar or wind, which are intermittent or nonexistent at peak times
  • Not more gas, which is a carbon emitter.
  • Not more hydro, there aren't enough rivers or mountains in UK
Which leaves
  • Undersea links to the continent, i.e. let someone else worry about it
  • Storage, which is expensive and some say carbon emitting 
  •  Time-shifting, as I've always said

Simple but not easy unless we all do our bit. Tens of thousands are already doing it, are you?

Tuesday, 6 June 2017

Make Hay while the Sun Shines


Domestic DSR is about sufficiency.
If we all do our bit for flattening demand, we will need far fewer new power stations, of whatever type.
It also means using renewable electricity when the sun shines or the wind blows.
But we need to know when there is a lot of slack in the system.
Hence the Time Cheese.
How helpful would it be to you to have one?

Tuesday, 16 May 2017

Which Appliances are Best to Time-shift?


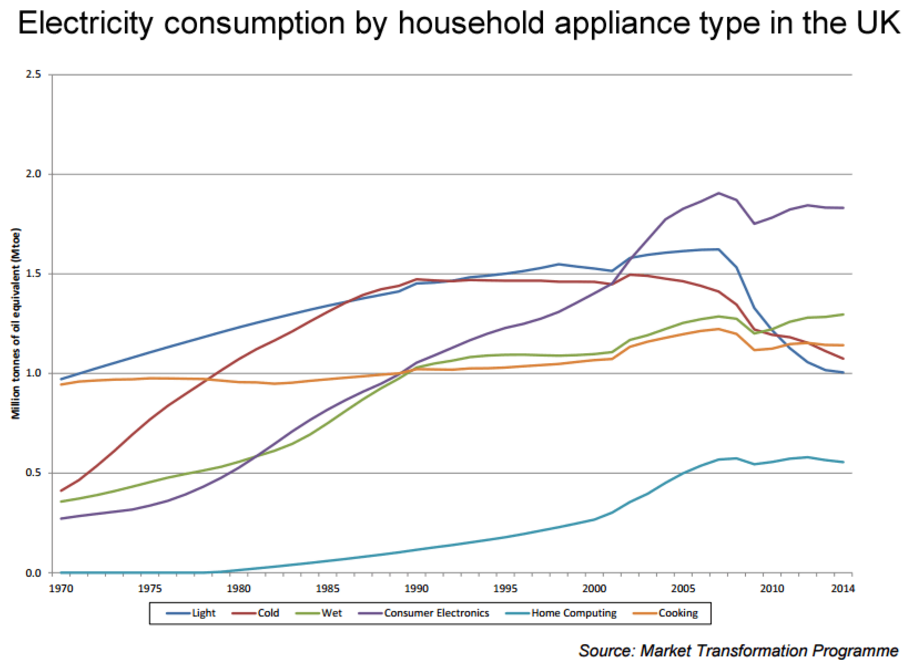
It is sometimes said that there is not enough energy consumed by wet appliances to eliminate 7GW of peak consumption by time-shifting them alone. I leave you to judge.

The trend of wet appliances’ consumption has been inexorably upwards, and is now second only to consumer electronics. Much of the increase is due to an undesirable increase in the use of tumble dryers, but I am not here to preach austerity. If you live in a flat or gardenless house, it may be the only realistic option.

Reading off the above graph, we have a Mtoe figure for each appliance type:

APPLIANCE TYPE
Mtoe 2014
GWh (Mtoe x 11,630)
PERCENT OF TOTAL
Light
1.0
11,630
14.2
Cold
1.1
12,793
15.7
Wet
1.3
15,119
18.5
Consumer Electronics
1.8
20,934
25.7
Home Computing
0.6
6,978
8.5
Cooking
1.2
13,956
17.1
TOTAL
7.0
81,410
100

There are around 80 winter days when it is desirable to reduce peak consumption by up to 7GW and by around  18GWh spread over the 5 hours of the peak, so by a total of 80x18=1440 GWh/year. This is 1.7% of total annual domestic consumption, and 9.5% of total annual wet consumption.

There are of course other candidates for time-shifted consumption as well as wet appliances.  Cold devices (mainly fridges and freezers in UK) and increasingly home computing (laptops, smartphones and tablets all have batteries) are if anything even less time-sensitive in direct grid consumption than wet appliances, and are now already 24% of the total vs wet appliances 18.5%. 

The reason we are not focussing on them is the relatively low consumption per device. A typical house may have three wet appliances and ten or more cold and computing ones.

Would you rather go for the wet or the cold and computing!

 It’s up to you. Both is best!


Power to the People now becomes power to, for, by with and from the People.


We are all prosumers now. In the world of food, the Slow Food movements has renamed consumers co-producers - on the basis that when we buy something, we are collectively responsible for the whole supply chain that brings it to us.
 The same can be said of electricity - and we all have the scope to affect the supply chain. The easiest way to begin to do this is to use less - and then to use it when we choose to.
 I choose to use electricity for discretionary purposes at night and when the sun is shining. What do you do?
There are no right or wrong answers, just the power to make informed choices.

Tuesday, 18 April 2017

Cutting Peak Consumption Dramatically Reduces Coal-fired Production


Look at these graphs from the right hand side first. The red line on the far right graph shows the admirable decline in coal fired electricity in UK over the last five years.
Over the past year, however, there was a nasty peak in the second half of January, when coal fired stations were brought out of mothballs - see the second graph from the right.
This peak coincides with maximum electricity demand for the year.
As usual the message is clear - reduce demand at peak times to reduce carbon!

Thursday, 13 April 2017

Should we adopt Nicaraguan Domestic Electricity Pricing Policies?


If we adopted the Nicaraguan approach, low consumption users would be charged less per unit, and cross-subsidized by domestic consumers who use more.

"Currently, there are cross-subsidies in the tariff structure. Medium voltage consumers pay higher tariffs that serve to subsidize lower tariffs for low voltage consumers. Users that consume less than 150 kWh per month receive transfers from the rest of the consumers. The lowest-consumption users (0-50kWh/month) benefit from reductions between 45% and 63% in their average tariff. Consumers above the 50kWh limit also benefit from the subsidy scheme to a smaller extent." (Wikipedia) 

Easily done with smart meters! No net cost to the Government! Incentive to use less!

Friday, 24 February 2017

First Four Days Data from my New Owl Intuition


This is my electricity consumption for four days to 11.00 am on 22nd Feb 2017. There are large peaks for electric shower use, and smaller peaks for off peak heaters at night, and electric kettles.
I am reasonably happy with the relatively low consumption between 3 and 8pm, but I do have an immersion heater that kicks in very shortly thereafter. My wife complains if I leave it any later for it to start! Average consumption is running at 23.5 kWh (units) per day, only just under 1kW average, so let's see if I can reduce that. It should be relatively easy to do so as the seasons warm up (we have no aircon here in chilly England), the big test will be whether I can improve on like-for-like consumption over the years.  I now have almost entirely LED lighting, and mainly new A+++ fridges and freezers. The big consumers are night-time heating, washing appliances and immersion heaters.