Thursday, 19 January 2017

Production peaking at a remarkably stable 50GW


Peak production over the last week has been bumping along as if there were an upper cap of 50 GW. Is this a chance event, or has the National Grid been leaning on big consumers?
The 3-8pm peak remains, though, but at an agreeably lower level of 5GW above daytime consumption. Hooray! Any comments on how much this is by accident and how much by design?

Thursday, 12 January 2017

Peak demand lower at 50GW, but 7GW rise remains

UK National Grid Production at 0930 on Thursday 12th January 2017.

Demand peaked at 50.2 GW on 5th January 2017, an encouragingly low level. Total average demand continues to trend down thanks to energy efficiency, LED's etc.
But the peak of 7GW in the early evening remains - we are better at efficiency than we are at demand side response.
But DSR is easier to achieve once we have sufficient awareness of its low cost and high value.
So keep time-shifting and keep telling your friends!

Tuesday, 3 January 2017

Green Energy Introduces a Domestic Time-of-Use Tariff

Green Energy Domestic Time-of-Use tariff 1st Jan 2017.
On New Year's Day, Green Energy announced the first 3 price domestic time of use tariff in UK .

Costs are:

Peak       24.99p   16:00-19:00 weekdays

Off Peak  4.99p    23:00-06:00 every night

Normal   11.99p  at all other times

I currently pay 17.6p normal and 5p off peak, on Ecotricity's new Energy Plus tariff. I calculate that ignoring the off peak I would need to use less than 43% of my electricity at peak times to make it worth changing. Unfortunately I am outside the radio range required by smart meters, so I can't switch.

As a fully signed up geek, I am happy to do this calculation, and to measure my hourly consumption using an Owl USB meter.
I wonder how many of us are willing or able to do that?
The simplest thing to do is to use less electricity at peak times, whatever the tariff you are on!

Saturday, 24 December 2016

Demand Response - How much is it a Behavioural rather than a Technical issue?


The above diagram is from a recent UK Government report on the use of smart meters to bring about demand response. It highlights the technical options for domestic load control. 
Below is a picture from the site of Oracle Opower, which shows their approach to influencing consumer behaviour.

The challenge now is to integrate the two, the technical and the behavioural approaches, to bring about significant behaviour change and load shifting.

Early adopters - I am one, are you? - can already do much of the load shifting without smart meters, and then tell others they are doing it. I do it, do you, is an effective message for us to spread.


Wednesday, 21 December 2016

Happy Christmas!


Good news!

In the two weeks from Christmas day, peak electricity demand is lower because so many businesses are closed -so you can have plenty of LED lights on to cheer things up!

You're not getting away without a graph though! The dots on the right hand chart mark the average electricity demand in UK for the two weeks of Christmas last year, nice and low! Daily chart is for 21st Dec 2016 taken at 11am.


Friday, 16 December 2016

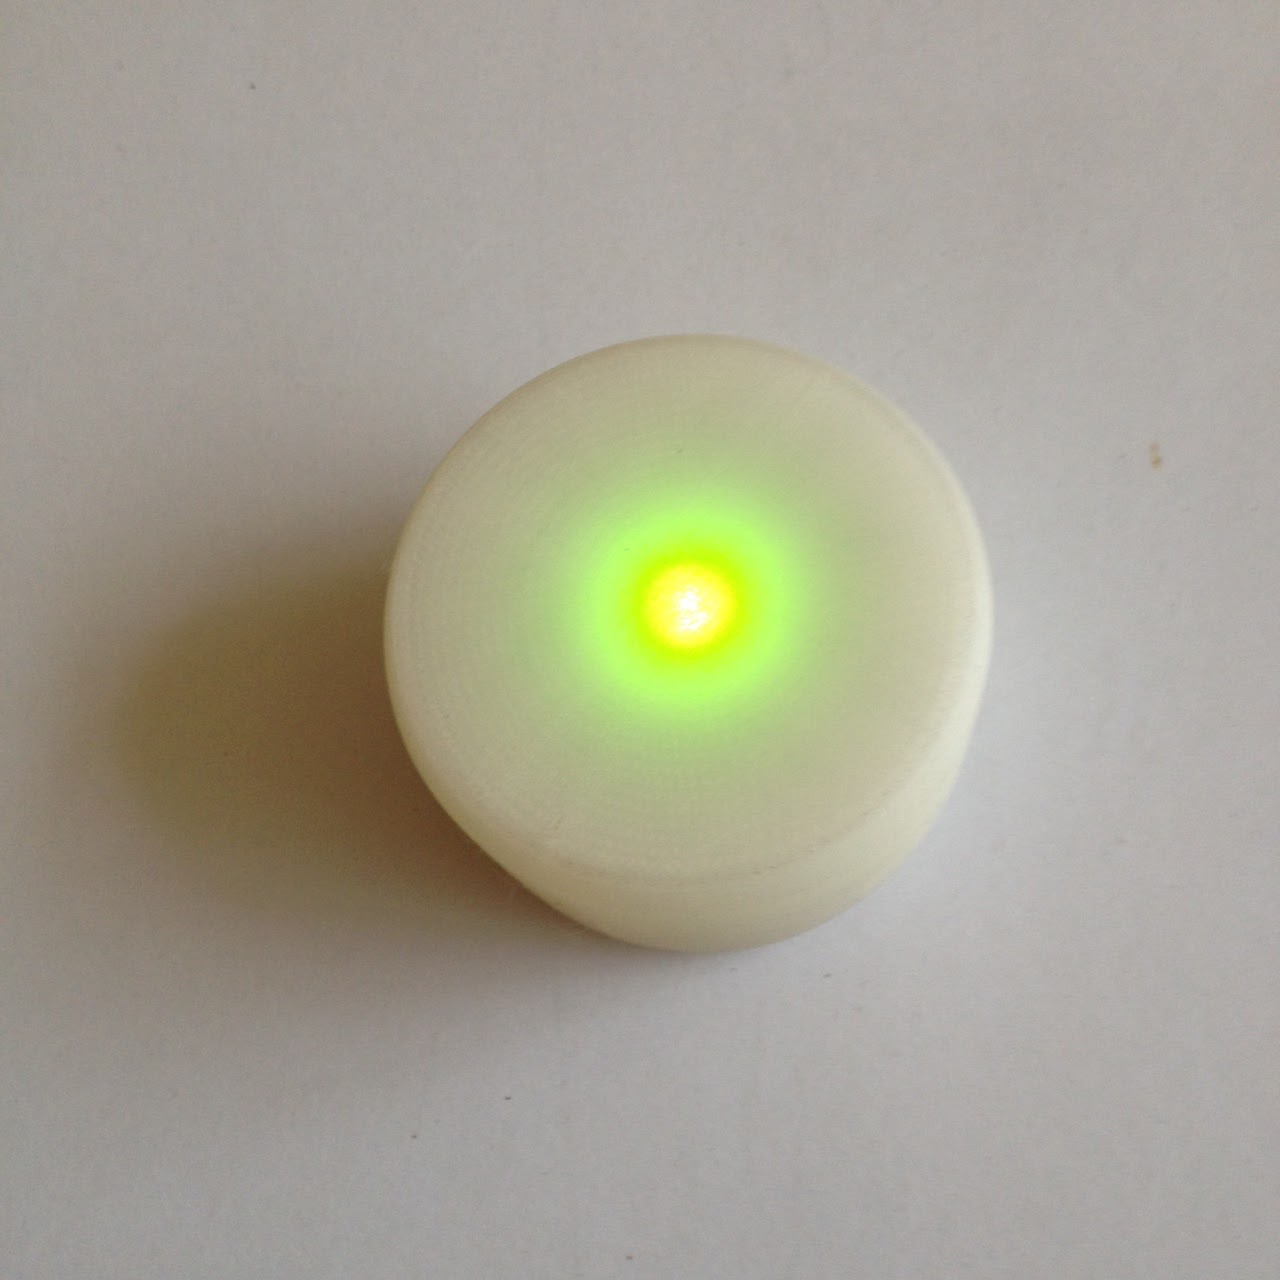
My latest traffic light


This is the latest iteration of the light bulb 

It glows:
  • Green from midnight to 7am
  • Red from 3pm to 8pm
  • Amber at other times
If everyone had one, and shifted their discretionary consumption from the red to the green periods, we could avoid two more Hinkley C's!

Let me know if you want one!


Thursday, 15 December 2016

How cheap does storage need to be?

When I mention domestic demand response I increasingly hear storage as being the solution.
But how cheap does storage need to be to break even? Turnkey solutions at the moment cost around £500 per kWh. To get the cost down to a retail price of domestic electricity of 12p/unit, each kWh of storage would need to be used around 4000 times, that's once a day every day for 11 years. 
So:
  • The battery and equipment would need to last for 4000 cycles before it broke even.
  • If it did, the minimum time to break even is 11 years.
  • This assumes the electricity going in to the battery is "free" i.e. from a PV installation where no other use for the electricity can be found.
In practice the load factor would be much less than 100% on a daily basis, thus reducing the returns further.

The price would need to at least halve to get any chance of a six year payback, which is what was needed from FITs to get mass PV installation going.

Do batteries last for 4000 cycles? 500-1000 cycles is more typical for lead acid.

Why not just shift the time at which you use electricity - it's virtually free to do so!